
Live Chat
Live chat shows how your team handles the chats that AI agents and chatbots hand over. You see how many people ask for a team member, how fast you answer and how many chats end well. Use it to plan your team and to spot slow replies.
Prerequisites
A BotPenguin account with Analytics access in your plan and your role.
Live chat set up with team members, and some live chats in the date range.
Key definitions
Date range
The period of time the whole page shows.
Filter by
A menu on a chart or card that limits the data to chosen AI agents, chatbots and more.
Key analytics
The row of cards with the main totals of a page.
Live chat
A chat handled by a team member instead of an AI agent or chatbot.
Team member
The person on your team who answers a live chat.
Open Live chat
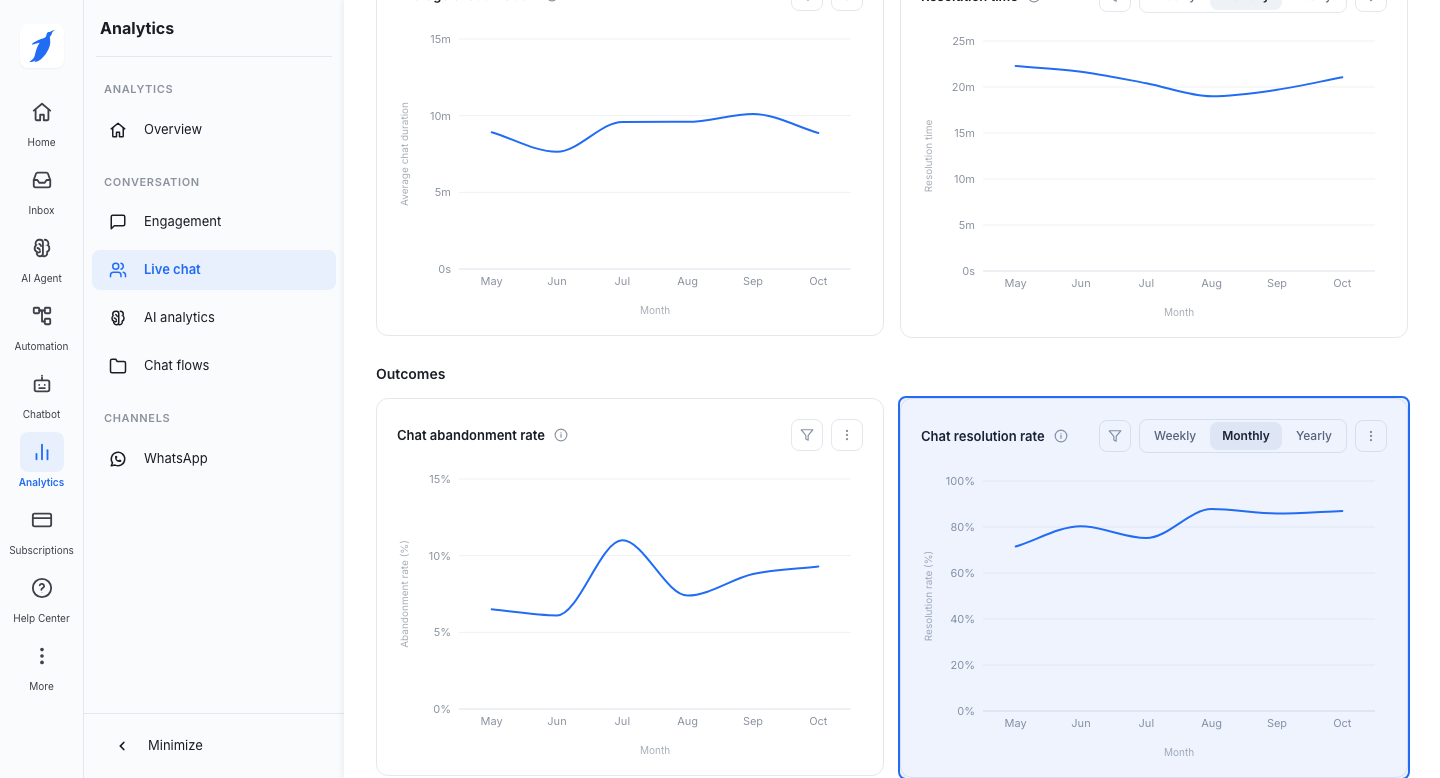
Click Live chat in the Analytics sidebar. Every chart follows the date range of the page and the common features in Use the Analytics section: filters, the Weekly / Monthly / Yearly switch, Download and Expand. On this page we call the person who answers a "team member". All times show in minutes and seconds. Every chart can be filtered by Team members, AI agents and AI chatbots. Team members shows only the chats handled by the team members you pick. AI agents and AI chatbots show only the chats handed over from the ones you pick.
Requests
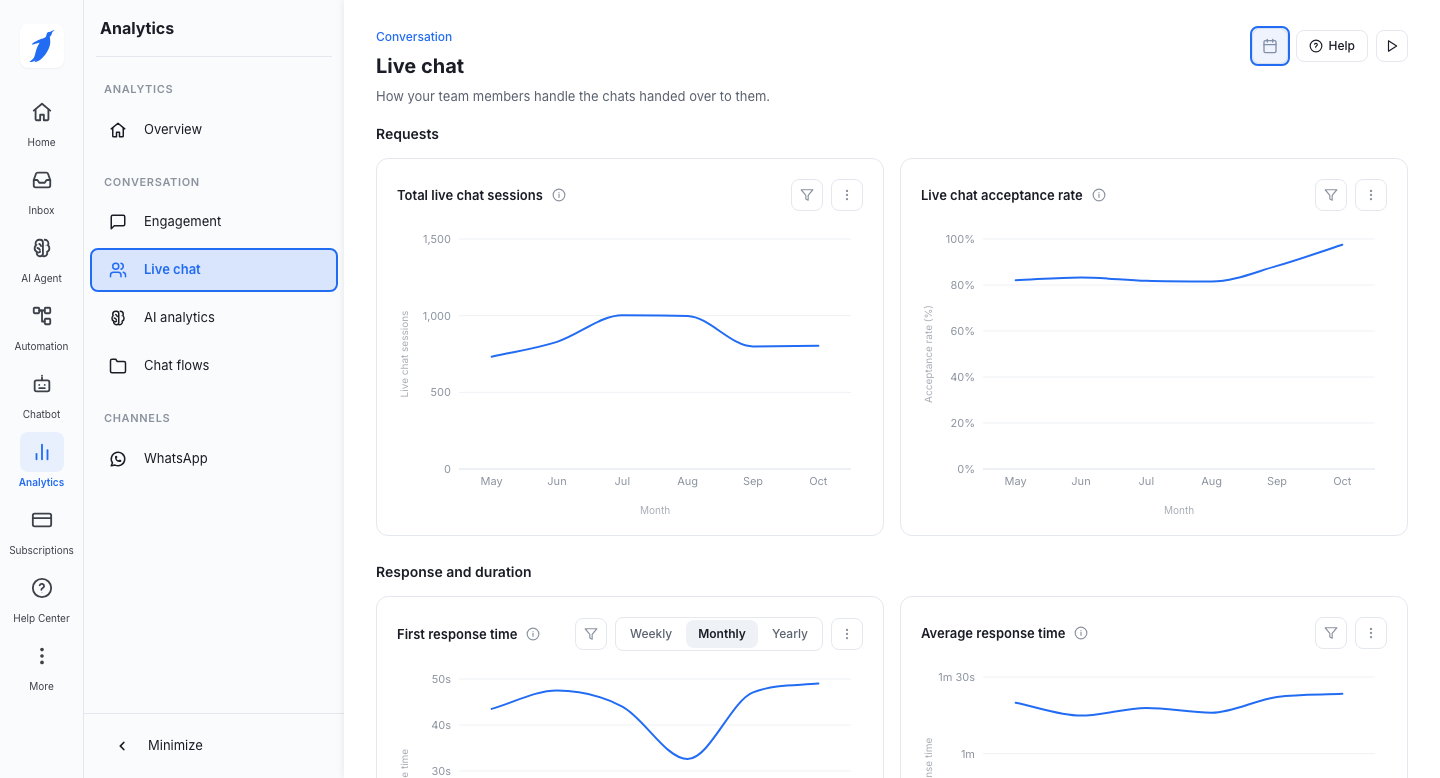
Total live chat sessions
What it shows: The number of sessions in which a live chat with a team member was requested.
Chart type: Line chart.
Axes: X-axis: Time. Y-axis: Live chat sessions.
Filter by: Team members, AI agents and AI chatbots
Weekly / Monthly / Yearly switch: Yes.
How to use it: It shows how much customers want live support.
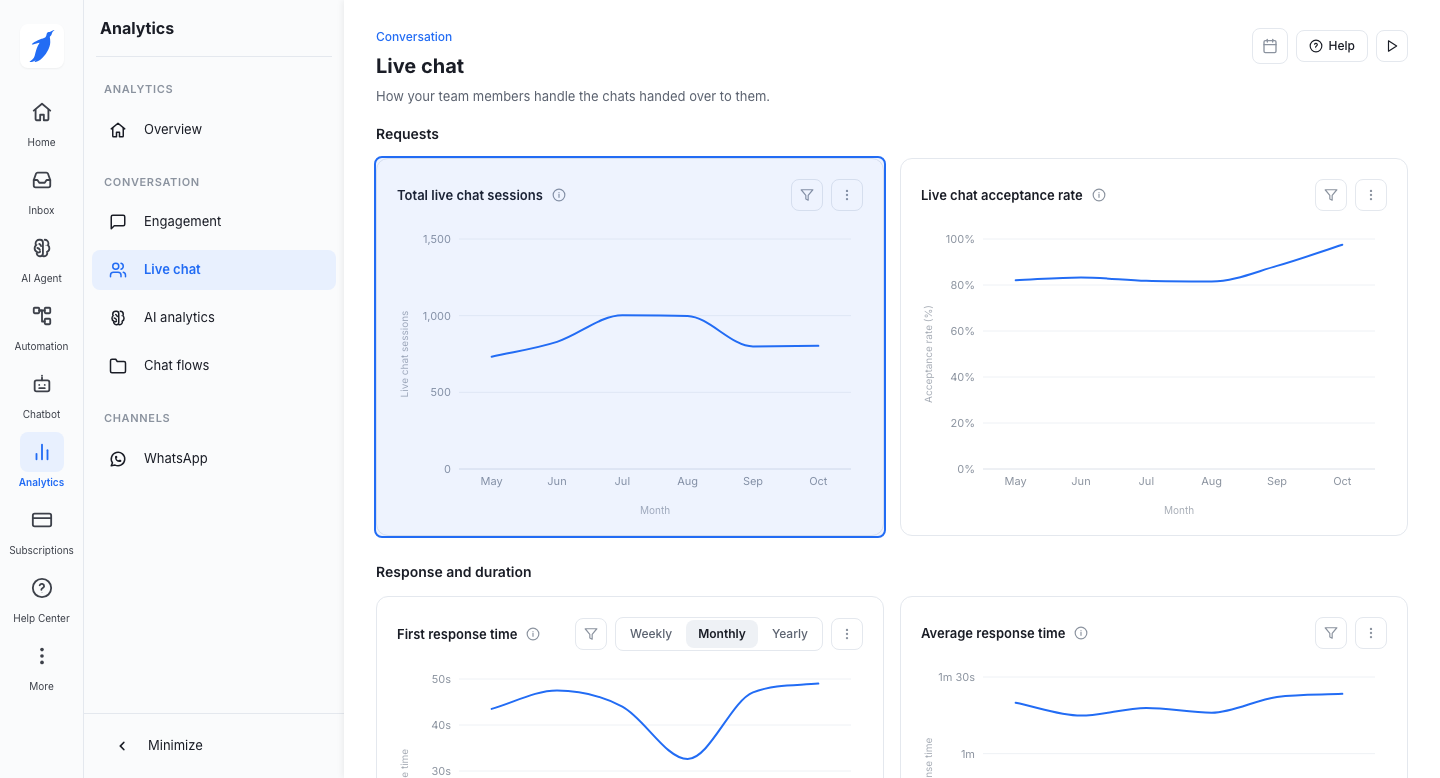
Live chat acceptance rate
What it shows: How often a requested live chat was accepted by a team member. It is the share of live chat requests accepted.
Chart type: Line chart.
Axes: X-axis: Time. Y-axis: Acceptance rate (%), from 0% to 100%.
Filter by: Team members, AI agents and AI chatbots
Weekly / Monthly / Yearly switch: Yes.
How to use it: A high rate means your team is available and quick to respond.
Response and duration
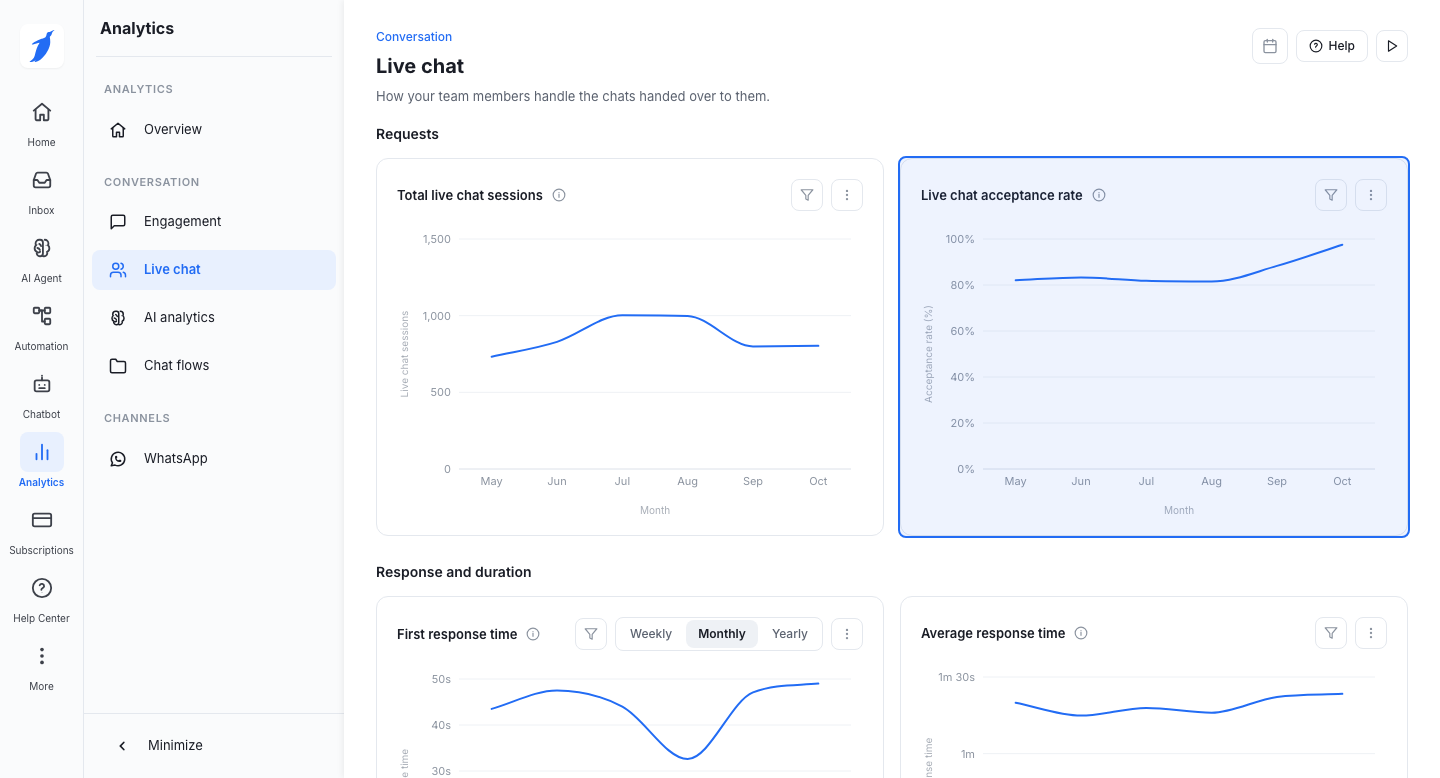
First response time
What it shows: How long a team member takes to answer for the first time, from the moment the live chat was requested.
Chart type: Line chart.
Axes: X-axis: Time. Y-axis: First response time.
Filter by: Team members, AI agents and AI chatbots
Weekly / Monthly / Yearly switch: Yes.
How to use it: A faster first reply makes customers happier and means fewer customers leave.
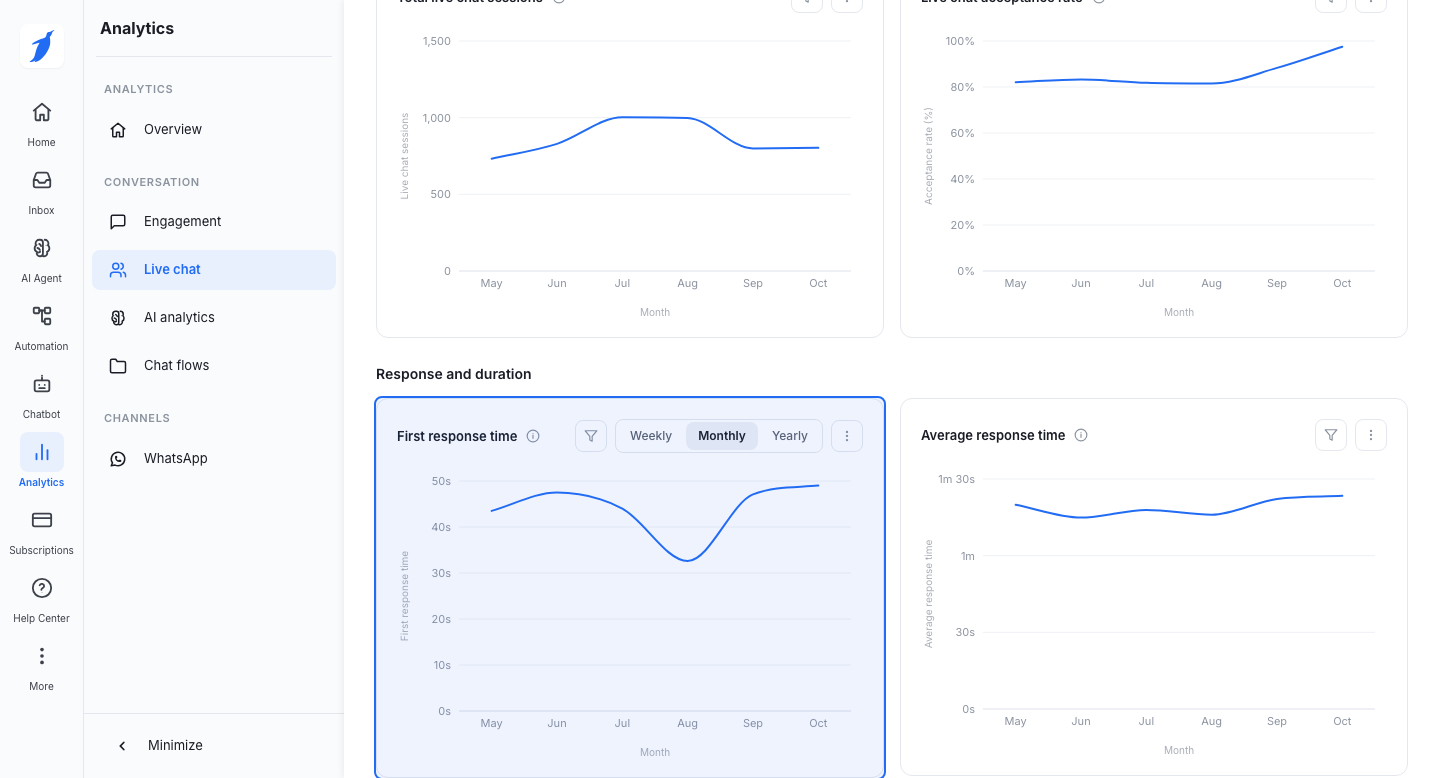
Average response time
What it shows: On average, how long a team member takes to reply each time the customer sends a message in a live chat.
Chart type: Line chart.
Axes: X-axis: Time. Y-axis: Average response time.
Filter by: Team members, AI agents and AI chatbots
Weekly / Monthly / Yearly switch: Yes.
How to use it: It shows how actively your team takes part in a chat that is going on.
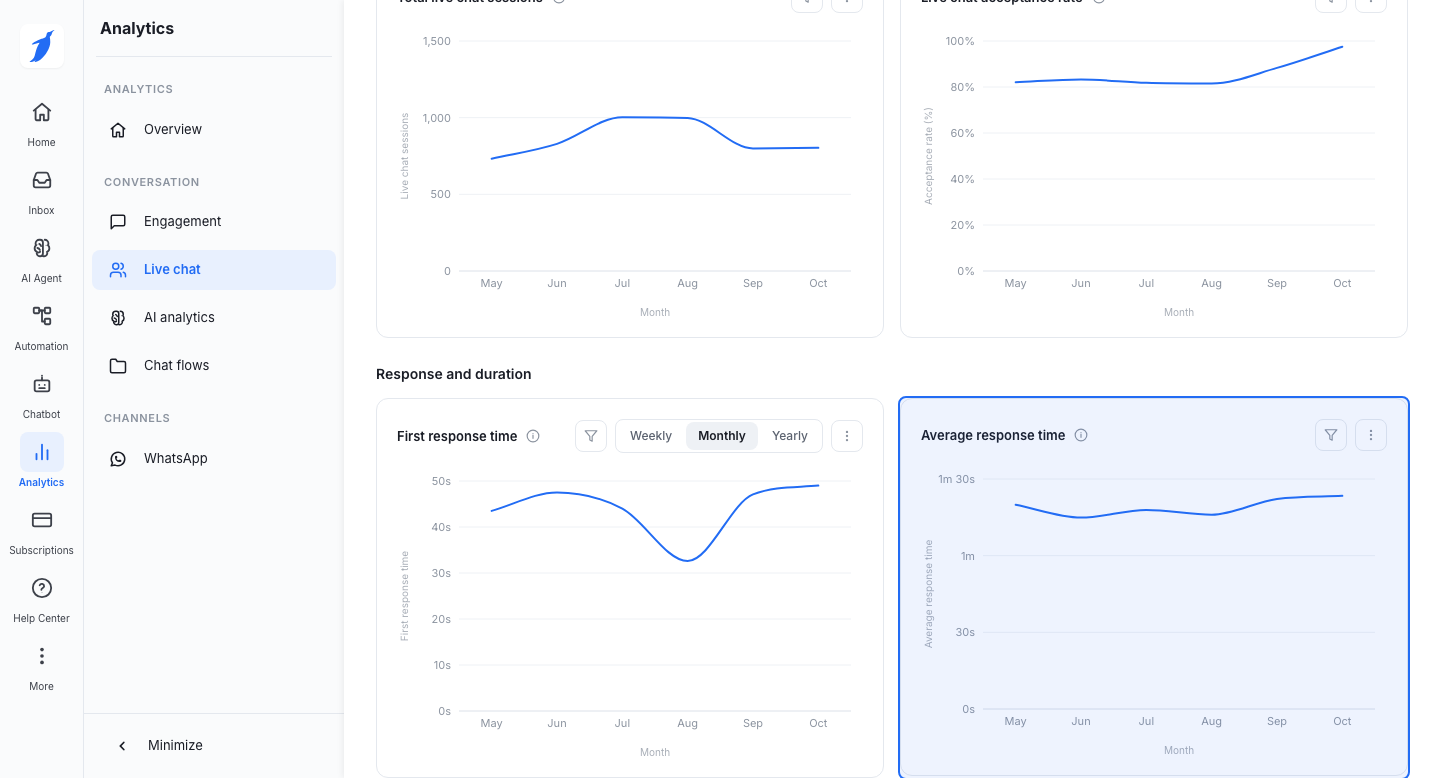
Average chat duration
What it shows: The average length of a live chat, from when it starts to when it ends.
Chart type: Line chart.
Axes: X-axis: Time. Y-axis: Average chat duration.
Filter by: Team members, AI agents and AI chatbots
Weekly / Monthly / Yearly switch: Yes.
How to use it: It helps you see how hard the chats are and how efficient your team is.
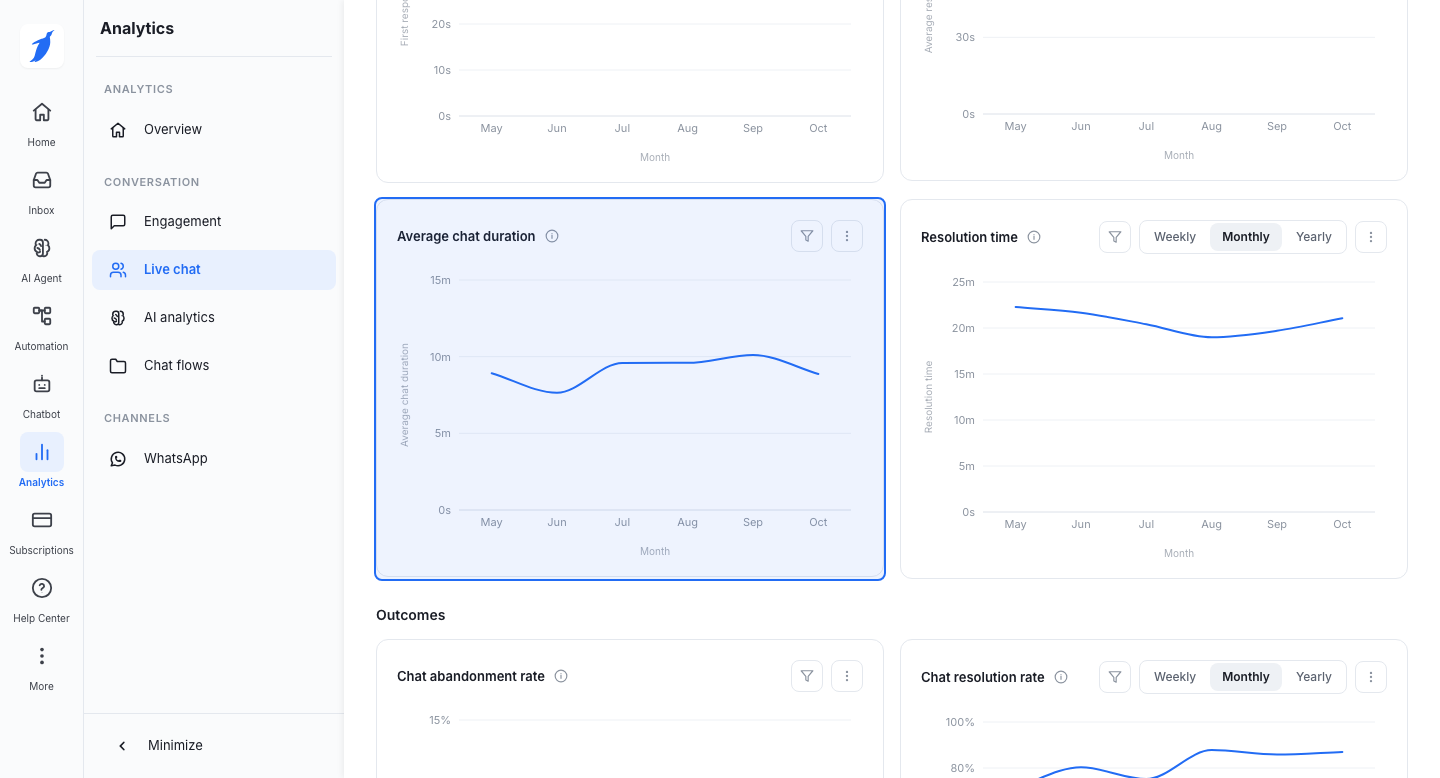
Resolution time
What it shows: On average, how long a team member takes to resolve a chat.
Chart type: Line chart.
Axes: X-axis: Time. Y-axis: Resolution time.
Filter by: Team members, AI agents and AI chatbots
Weekly / Monthly / Yearly switch: Yes.
How to use it: Shorter times mean your team solves issues well. Compare it with Average chat duration to see if long chats are hard or slow.
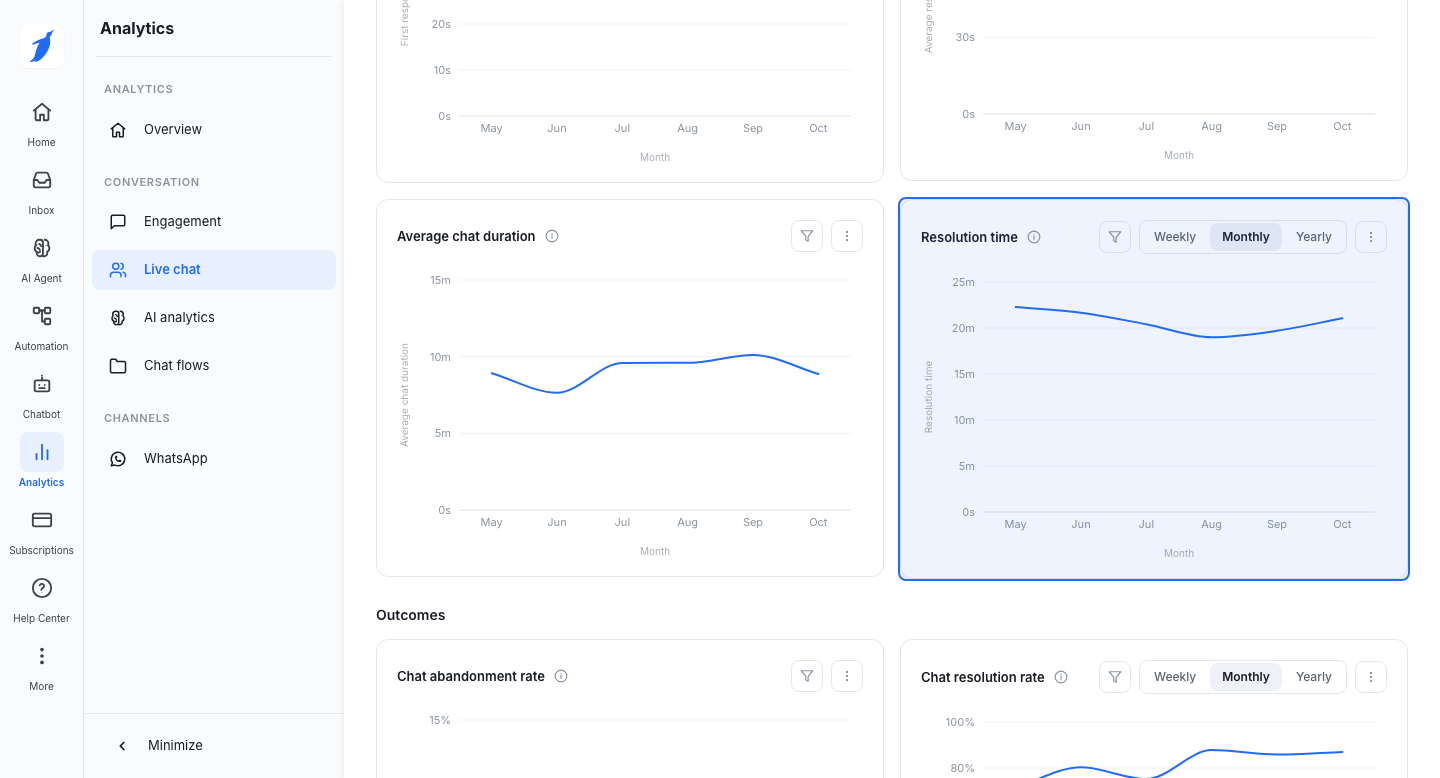
Outcomes
Chat abandonment rate
What it shows: The share of live chats the customer left before they were answered or finished.
Chart type: Line chart.
Axes: X-axis: Time. Y-axis: Abandonment rate (%).
Filter by: Team members, AI agents and AI chatbots
Weekly / Monthly / Yearly switch: Yes.
How to use it: A high rate can mean slow replies or long waiting times.
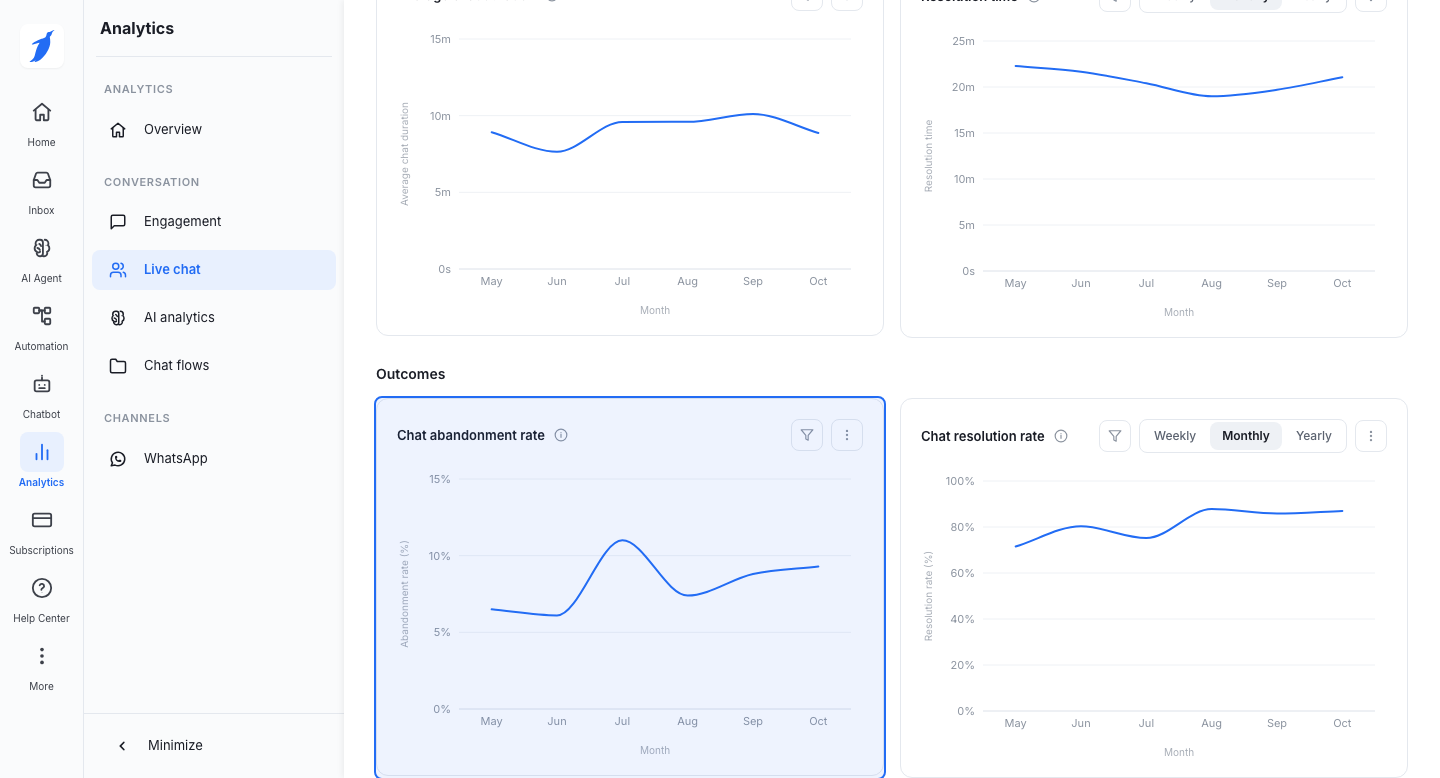
Chat resolution rate
What it shows: The share of live chats a team member marked as resolved.
Chart type: Line chart.
Axes: X-axis: Time. Y-axis: Resolution rate (%), from 0% to 100%.
Filter by: Team members, AI agents and AI chatbots
Weekly / Monthly / Yearly switch: Yes.
How to use it: A higher rate means better support results.
Tips
Watch First response time and Chat abandonment rate together. Slow first replies often lead to more abandoned chats.
Use Live chat acceptance rate to check if your team has enough people at busy times.
Use the filters to find where the results differ between team members, AI agents and chatbots.
[CHECK: the old page says First response time starts "after a chat is assigned". The PRD says it starts when the live chat was requested. The text follows the PRD. Confirm.]
[CHECK: the old page lists Daily as the time grouping. The new page has Weekly, Monthly and Yearly only.]
[CHECK: the old page says the filters are Date range, Bots and Team. The PRD adds AI agents as a filter. Confirm.]
[CHECK: the PRD names the sidebar item "Live Chat". The prototype shows "Live chat".]
Common errors
Support
Still not working? Write to us at support@botpenguin.com. We will reach out to you within 24 hours.